文献信息:
Wu Songjun*, Soulsby Chris, Zheng Yi, Musolff Andreas, Tetzlaff Doerthe. Divergent evolution of nitrogen cycling along gradients of landscape water velocities. Science, 2026, 392(6803): 1188-1193. https://doi.org/10.1126/science.aed0399
Science最新(2024年)影响因子:45.8
Editor’s summary:
What is the long-term fate of all the excess nitrogen that has been injected into the environment by fertilizers and other anthropogenic activities? Wu et al. found that changes in nitrogen cycling are governed primarily by shifts in water velocity, the speed at which water moves in a system (see the Perspective by Futter). Using a model that incorporates the isotopic compositions of hydrogen and oxygen in water, the authors showed how hydrological transitions beyond “wetness boundaries” amplify nitrogen accumulation and leaching, whereas conditions within those boundaries mitigate these processes. Their findings identify emerging water-quality risks due to climate change and highlight the need to mitigate extreme hydrological shifts. —Jesse Smith
Abstract: Increasing fertilization has pushed the nitrogen cycle beyond planetary boundaries, yet its fate remains uncertain owing to long-standing neglect of landscape water velocities in nitrogen models. Leveraging isotope-aided modeling across 3821 European catchments, we demonstrate that evolution of nitrogen cycling is strongly linked to shifts in landscape water velocities since 1980. We propose the concept of “wetness boundaries,” where hydrological transitions beyond boundaries amplify nitrogen accumulation and leaching, whereas conditions remaining within boundaries mitigate these processes. Applying this framework, we project reduced nitrogen leaching across 76% of Europe under mild hydrological shifts by 2100 but increasing nitrogen accumulation under pronounced deceleration of water cycling in Eastern and Southern Europe. These findings underscore emerging water quality risks under climate change and the need to mitigate extreme hydrological shifts.
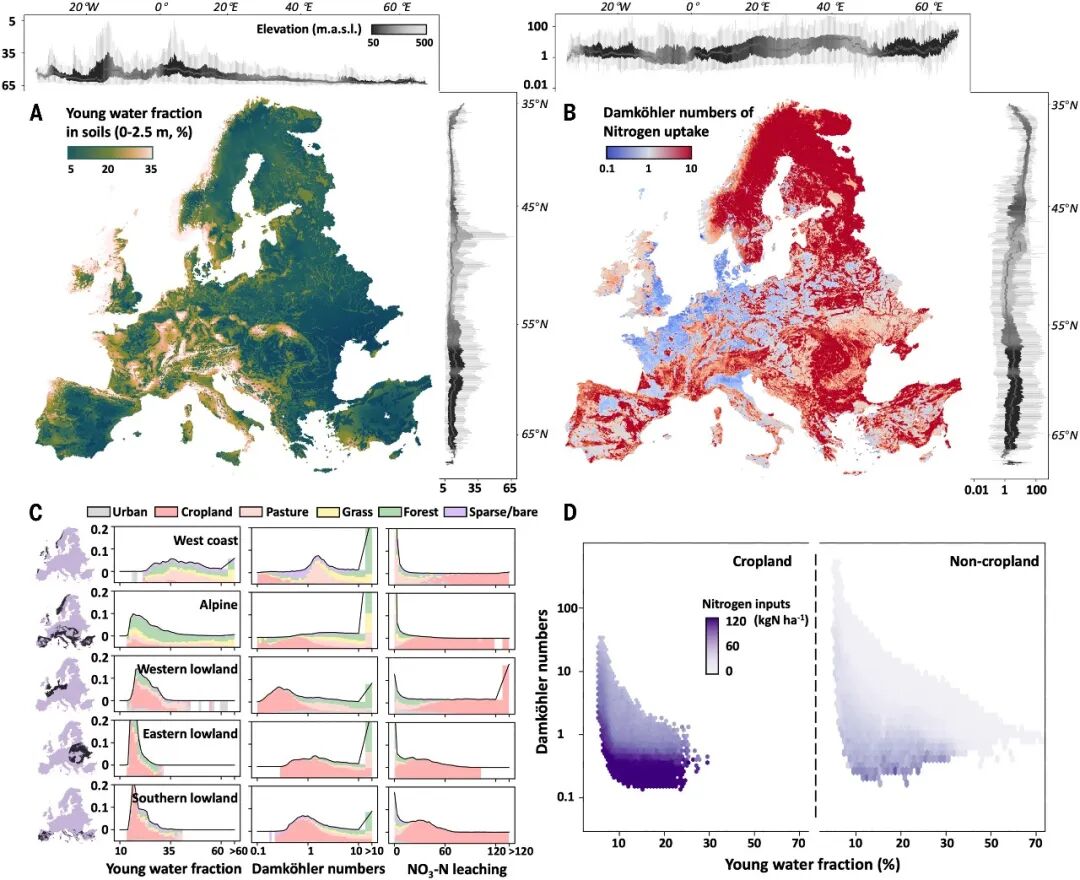
Fig. 1. Spatial patterns and statistical characteristics of young water fraction and Damköhler number for nitrogen removal across Europe. (A and B) the mean values of young water fraction and Damköhler number during 1982 to 2024, with inset boxplots summarizing their minimum, maximum, 25th to 75th percentiles, and median values along latitude, longitude, and elevation. (C) Probability density distributions of young water fraction (percentage), Damköhler number, and NO3–N leaching (kilograms of nitrogen per hectare) across different land use types. (D) Correlations among young water fraction, Damköhler number, and nitrogen inputs.
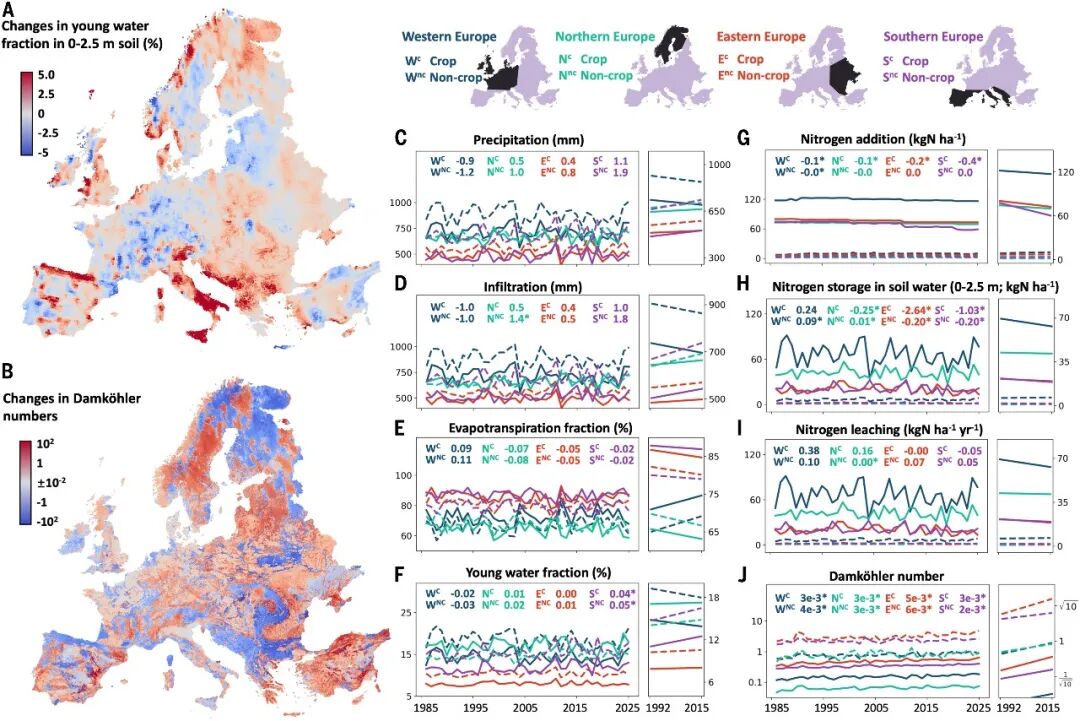
Fig. 2. Temporal dynamics of hydrological and nitrogen states or fluxes during 1982 to 2024. (A and B) The differences of young water fraction (A) and Damköhler numbers (B) between 1982 to 1992 and 2014 to 2024. (C to J) The annual dynamics of representative hydrological and nitrogen states, fluxes, and statistics across four different European regions (reflected with four colours). In each panel, cropland (C) and noncrop (NC) regions are represented by solid and dotted lines, with linear regressions displayed on the right. The numbers are the slopes of linear regression, with an asterisk indicating the significance of monotonic trend (*P < 0.05).
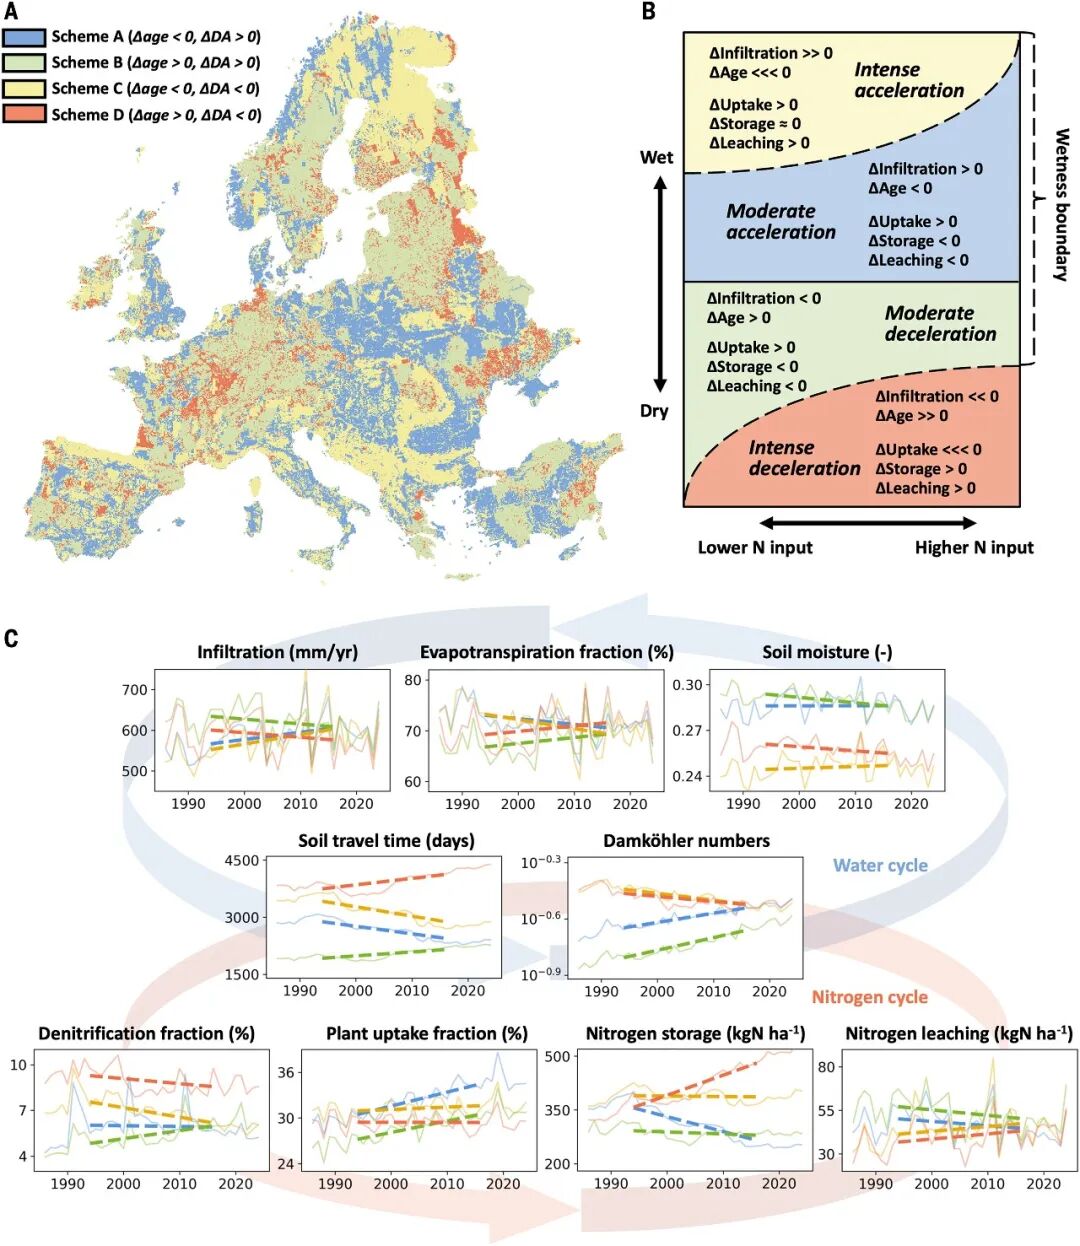
Fig. 3. Divergent evolution schemes of water and nitrogen cycling. (A and B) Spatial distribution and conceptual schematics, respectively. (C) Temporal trends of key hydrological and nitrogen states, fluxes, and statistics under each of the four schemes. The full and dotted lines represent the annual means and linear regressions, respectively. Age, uptake, storage, and leaching are the abbreviations for soil travel time, nitrogen uptake (sum of soil denitrification and plant uptake), soil water nitrogen storage, and nitrogen leaching, respectively.
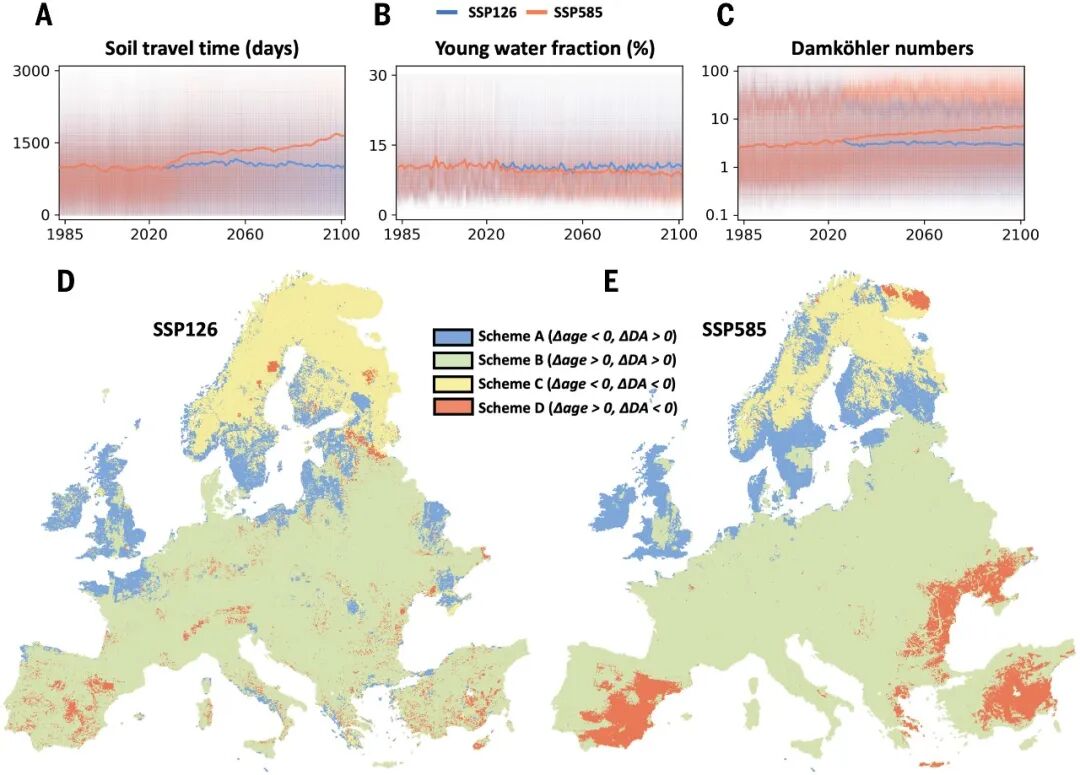
Fig. 4. The projected evolution of water and nitrogen cycling from 2025 to 2100. (A to C) Temporal dynamics of median soil travel time, young water fraction, and Damköhler numbers across Europe, respectively. (D and E) Spatial distribution of the four water-nitrogen coevolution schemes under SSP1-2.6 and SSP5-8.5 scenarios. The schemes are classified based on the projected changes in soil travel time and Damköhler numbers between 2015 to 2025 and 2090 to 2100 (fig. S10).